
The Seerbit dashboard gives you an overview of how your business is performing. The following steps 1 - 4 in the image below will help you get familiar with your Dashboard Home page.
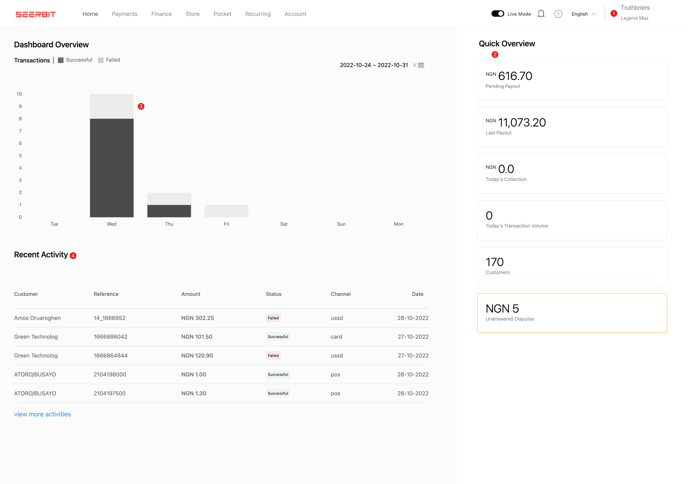
1. Search Bar
We have made the search bar constant on the header of every page to enable you search for transactions, customers, and payment references from any page on the dashboard.
2. Recent Activity
This shows a list of the top 4 most recent transactions
3. Summary
This section shows a total summary of the activities on your dashboard. i.e total number of customers, total number of payments received after activation, total amount earned as a business and your settlements.
4. Revenue Graph
The revenue graph represents your transaction values for the selected date range. This section also shows you the total payments you've collected within the selected date range.
The blue line represents successful transactions while the red line represents failed transactions.